
Vehicle crime in Peckham Rye ward hit 33 in July against a usual 6, and 195 across 11 local wards. Street-by-street figures and a ward crime table.
Police recorded 33 vehicle crimes in Peckham Rye ward in July 2026. In each of the previous 12 months the ward logged between 2 and 11.
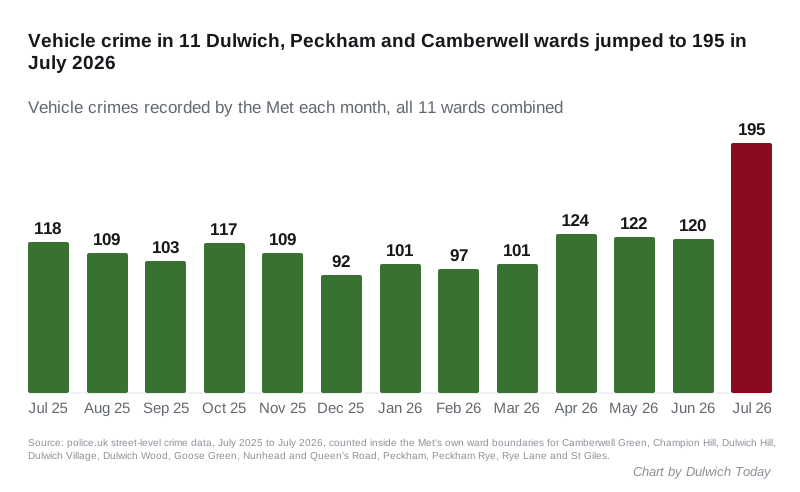
The rise was not confined to one ward. Across the 11 wards that make up Dulwich, Peckham and Camberwell, vehicle crime reached 195 in July. That is the highest monthly total in the 13 months we checked, and 65% more than the 118 recorded in July 2025.
The figures come from the police.uk street-level crime data, which the Home Office publishes about two months in arrears. July 2026 is the latest month available. We counted every crime inside the Metropolitan Police’s own boundary for each ward, rather than a radius around a single point.
Where the July cases were
Police.uk places each crime “on or near” a street rather than at an exact address. In Peckham Rye ward, the 33 July cases were spread over at least 15 residential roads, most of them east of the park. The streets with more than one were:
- Waveney Avenue: 6
- Bellwood Road: 4
- Harlescott Road: 3
- Surrey Road, Inverton Road, Lanbury Road and Fernholme Road: 2 each
All 33 are listed with the outcome “Investigation complete; no suspect identified”.
Vehicle crime in police.uk covers theft of a vehicle, theft from a vehicle and interference with one. The data does not say which of the three each case was.
July compared with the rest of the year
Most of the Dulwich and Peckham wards saw a jump in July, not just Peckham Rye.
| Ward | Vehicle crime, July 2025 | Vehicle crime, July 2026 |
|---|---|---|
| Peckham Rye | 6 | 33 |
| Peckham | 11 | 25 |
| Nunhead and Queen’s Road | 14 | 22 |
| Dulwich Wood | 14 | 19 |
| Rye Lane | 9 | 19 |
| Dulwich Hill | 7 | 18 |
| Dulwich Village | 15 | 18 |
| Goose Green | 14 | 18 |
| Camberwell Green | 13 | 11 |
| St Giles | 10 | 7 |
| Champion Hill | 5 | 5 |
Dulwich Hill’s 18 was its highest month in the period, against an average of about 7. Dulwich Wood also had its busiest month for crime overall, with 106 offences and anti-social behaviour reports in July. Its previous high in the period was 80, in July 2025.
One month is not a trend, and a cluster of break-ins by the same people can move a ward’s figure a long way. August’s data, due in late October, will show whether July was a spike or a new level.
Crime by ward over a full year
Over the 12 months to July 2026, the 11 wards recorded 16,808 crimes and anti-social behaviour reports between them. The busiest ward by far was Rye Lane, which takes in Peckham’s main shopping street and the station.
| Ward | Crimes and ASB, Aug 2025 to Jul 2026 | Per 1,000 residents |
|---|---|---|
| Rye Lane | 3,292 | 227 |
| Camberwell Green | 2,572 | 166 |
| Peckham | 2,116 | 143 |
| St Giles | 2,026 | 127 |
| Nunhead and Queen’s Road | 1,839 | 118 |
| Goose Green | 1,385 | 102 |
| Dulwich Hill | 804 | 84 |
| Dulwich Wood | 771 | 73 |
| Dulwich Village | 749 | 73 |
| Champion Hill | 622 | 67 |
| Peckham Rye | 632 | 62 |
The rate uses each ward’s population from the 2021 Census, the latest official ward count. Read it with care. Wards with busy high streets, stations and nightlife record crimes against visitors as well as residents, so their rate per resident will always look high.
Peckham Rye ward had the lowest rate of the 11 over the year, which is part of why its July figure stands out.
What it means for you
- If your car was broken into or tampered with, report it to the Met online or on 101, even if nothing was taken. The figures above only count what was reported.
- Check your street’s figures yourself. Put your postcode into police.uk for a map of reported crime and contact details for your ward’s Safer Neighbourhood Team.
- Remove anything visible from parked cars, including charging cables and bags left on seats.
- If you park on a residential street, see our guide to parking in Dulwich for controlled zones and permit rules.
How we did this: we downloaded every crime record for each month from July 2025 to July 2026 from the police.uk API, using the Met’s published boundary for each ward, and checked that every record carried the month requested. The totals include anti-social behaviour, which police.uk publishes alongside crime. Excluding it, Rye Lane recorded 2,539 crimes over the year and Peckham Rye 537.
Have your say